![]() There are lots of reasons to choose a web interface over a native graphical
interface. Web interfaces are universal, work on most devices and platforms,
have very flexible and feature-rich design capabilities, and do not require any
installation for users. That being said, performance is still a big concern.
It is especially challenging if the data source for that application is AMPS itself –
the world’s most impressive messaging system that can easily overwhelm the fastest applications.
Which web grid components have enough capacity to handle millions of elements
and hundreds or even thousands of updates per second?
There are lots of reasons to choose a web interface over a native graphical
interface. Web interfaces are universal, work on most devices and platforms,
have very flexible and feature-rich design capabilities, and do not require any
installation for users. That being said, performance is still a big concern.
It is especially challenging if the data source for that application is AMPS itself –
the world’s most impressive messaging system that can easily overwhelm the fastest applications.
Which web grid components have enough capacity to handle millions of elements
and hundreds or even thousands of updates per second?
We’re about to find out!
Why and What
Our AMPS product is commonly used as a View Server for high-performance financial market systems. Our customers are often looking to us for advise on which components can best meet their needs.
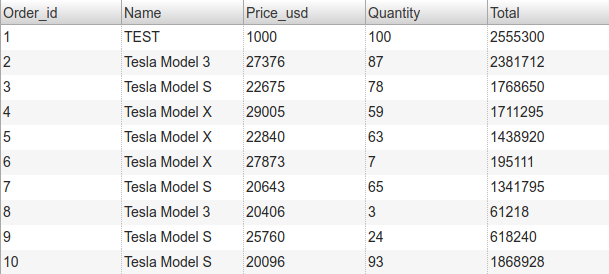
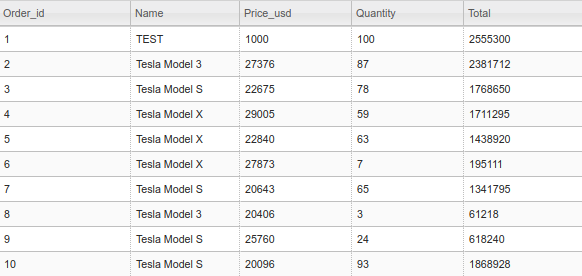
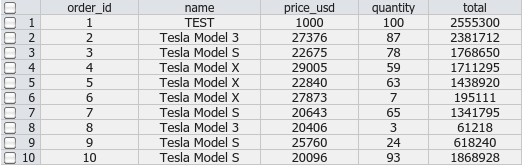
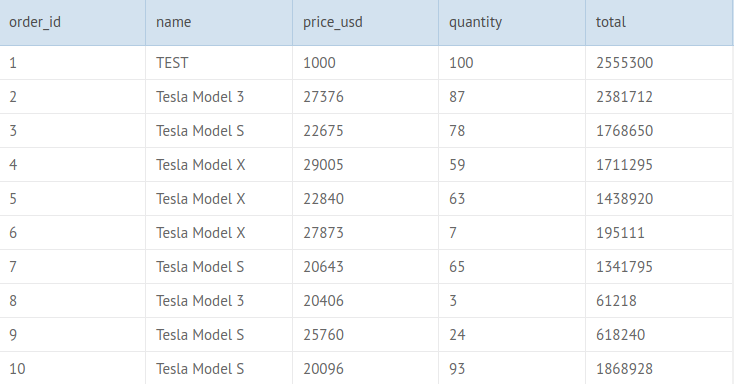
In these View Server use-cases, data received from AMPS is often displayed in some form of a grid. This is not static data though – the contents of the grid can change in real time, as AMPS delivers updates and new data. This article is a comparison to measure which web grids can provide a feature-rich, responsive, and memory-efficient solution to this use-case. Today, we are testing 5 different grids that promise great performance and rich functionality:
- ag-Grid 13.2.0: “The Best HTML 5 Grid In The World” is claimed to be used by over 15% of the Fortune 500 companies. To make it even more interesting, we will also test its React and Angular4 components, to detect how fast they perform compared to a pure JavaScript solution.
 ag-Grid 13.2.0
- SlickGrid: a very fast and snappy HTML grid that is designed for maximum performance.
 SlickGrid
- OpenFin’s HyperGrid 2.0.2: the unique grid that is using Canvas instead of DOM to render its contents. This feature allows HyperGrid to handle millions of rows of data and thousands of simultaneous updates without slowing down the user interface.
 HyperGrid 2.0.2
- Webix DataTable 4.3.0: part of Webix framework, DataTable component provides a highly efficient grid that delivers blazing fast performance.
 Webix DataTable 4.3.0
- PrimeNG DataTable 2.0.6: part of the popular Angular-based UI framework, it provides a rich feature set and great customization opportunities. Unfortunately, turned out it was way too slow in our tests, that’s why it was excluded from the final results. Without pagination, the PrimeNG grid can only handle ~5K records without having significant performance issues.
 PrimeNG DataTable 2.0.6
All the above grids have similar functionality, such as:
- Tree Tables
- Filters / Sorting
- Cell Editors
- Various selection models
- Live Updates
- Styling options
- Data Binding
Detailed feature descriptions are available on the grids’ websites.
How
Each grid in the above list claims to have incredible performance, but how would we determine who actually is the best? User experience is everything. The grid should look good, feel snappy, fit huge amount of data and yet still go easy on memory as it often is a limited resource. A good grid shows results of a query with subsequent updates that occur to that grid, such as deletes, updates, and new records. An average message size is 140 Bytes – it’s big enough to show meaningful information and is small enough to fit millions of such messages into the grid without taking all the available RAM. The following set of tests should give us a good picture of how the selected grids will perform in a real world situation:
-
Rendering Time: How much time it will take to render the initial portion of data. Fast rendering is important so that the web application loads and is ready to work as soon as possible. Another situation when fast rendering might be useful is switching data sets to display in the grid.
-
Frames Per Second (FPS): The more FPS a grid can produce while being used, the smoother and more responsive it looks and feels. Significant changes in FPS are perceived as freezes and should be avoided as much as possible.
-
Memory Consumption: If a grid is memory efficient, it can work well and do more on a device with a low amount of RAM, such as mobile devices and laptops. In our test we will measure how many rows/records a grid can render using no more than 4 GB of RAM.
-
Live Updates: Rendering the initial portion of data is important, but it means nothing if a grid cannot handle changes made to it in real time. According to MDN, “A frame rate of 60fps is the target for smooth performance, giving you a time budget of 16.7ms for all the updates needed in response to some event.” In this test we will measure how many rows per second we can add to the grid while maintaining maximum FPS and experience no lagging. Appending rows to the bottom of the grid is a pretty expensive rendering operation because the grid must update or change its view on every record added.
Environment
Hardware
- CPU: 6th Generation Intel® Core™ i7-6820HQ Processor (8MB Cache, up to 3.60GHz)
- GPU: NVIDIA® Quadro® M1000M 4GB
- RAM: 64GB DDR4 2133 MHz
- Storage: 1TB PCIe SSD
Software
- OS: Linux mint 4.10.0-35-generic #39~16.04.1-Ubuntu x86_64 GNU/Linux and Windows 10 Pro 64-bit
- Browsers:
- Google Chrome Linux 61.0.3163.100 (64-bit)
- Mozilla Firefox Linux 56.0 (64-bit)
- Microsoft Edge 40.15063.0.0 (64-bit)*
Don’t Make Your Customers Wait
Once the initial data portion of a query is loaded (typically, in a separate WebWorker, especially if it’s large), we need to display it in the grid. Considering the size of the initial portion, all grids did great, but as usual, some did better than others.
 Grid Comparison: Rendering Time – 20,000 records
 Grid Comparison: Rendering Time – 200,000 records
 Grid Comparison: Rendering Time – 2,000,000 records

The winner is SlickGrid with the mind blowing rendering time that’s independent of the number of records. The Angular4 version of ag-Grid had the best rendering performance among other ag-Grid components, possibly due to the VM-friendly code it produces. Another issue with ag-Grid we faced was its limitation when it comes to the maximum height of the grid container. This lead to the situation when rendering just stopped after 1,342,166 rows. This is not exactly a problem with ag-Grid, just a limitation in browsers which ag-Grid folks mention on their website, however, other grids don’t suffer from it. We solved this by reducing the row height, keeping the total container height below the maximum value.
Smooth Scroll is Important
Okay, we have our data loaded and rendered. Is the grid still responsive and snappy? Can we look through these rows without having a feeling that we’re watching a slide show? To make this test more objective, we were measuring FPS using Chrome Developer Tools. Scrolling using Touchpad/Mouse wheel simulates slow scrolling, while scrolling by dragging scrollbar will show how the grids are optimized for very fast scrolling. As before, we test for each dataset size.


This time, we have no clear winner, rather a group of “cool” kids, which are HyperGrid, Webix, and SlickGrid. ag-Grid Angular4 component had a significant FPS drop compared to its plain JavaScript and React analogues which showed good results otherwise. All grids have different mouse scrolling speeds, thus explaining the average FPS results in each case. HyperGrid truly fullfills its promise of Ultra High Performance and smooth scrolling with no deferred painting for unlimited data sets – it easily handles 2 million rows while maintaining very smooth and consistent experience. SlickGrid completely hides rows if scrolling is faster than some threshold value, thus making it easy to hit maximum results in the scrollbar test. Webix performs great with any dataset, providing the most consistent and smooth experience for both mouse and scrollbar scrolling tests while having no deferred painting. Subjectively speaking, all grids (except Angular4 ag-Grid component) felt very snappy and responsive.
How Much One Can Fit in 4 GB of Memory?
This a pretty straighforward test that answers one simple question – how much data can we display in the grid on an entry level desktop?

The winner in this test is Webix, closely followed by HyperGrid which has almost similar memory efficiency. The overhead introduced by React and Angular4 can be observed for ag-Grid; its plain JavaScript solution performed better than its enterprise-oriented counterparts.
It’s Alive!
Now the grid is loaded and rendered all of the original data, but that’s not enough –
without real-time updates, the dataset becomes irrelevant. AMPS features, such as
sow_and_subscribe command which delivers updates to the initial query set,
Content Filtering,
Preprocessing and Enrichment,
OOF messages,
and Conflation
provide fine-grained control over updates. These features, combined with our official
JavaScript client
make real-time grid updates a suprisingly trivial task, of course, if a grid can handle such power.

While ag-Grid has potential and would satisfy a small stream of updates without
lagging, the winner, HyperGrid, performed more than 20x better than ag-Grid.
It seems like HyperGrid and its Canvas-based rendering engine truly is the future
of fast web components, delivering incredible performance close to native interfaces.
Licenses and Pricing
Here we want to provide a quick overview of what licenses are available for each grid and what the prices are for commercial technical support at the time of this writing. Most grids also have free editions as well, although they are not always Open Source compatible.
| ag-Grid | |
| Free: MIT |
Commercial:
|
| HyperGrid | |
| Free: MIT |
Commercial:
|
| PrimeNG | |
| Free: MIT |
Commercial:
|
| SlickGrid | |
| Free: MIT | Commercial: Not available |
| Webix | |
Free: GPLv3
|
Commercial:
|
Development resources
Development resources are not important for users, but are for developers. Great documentation and manuals can save hundreds of hours of valuable developer time otherwise spent browsing through docs, googling, or waiting for a ticket to be addressed by a grid’s tech support.
So far, here’s our rating on how good the development resources are for the grids (subjective, yet pretty accurate):
-
ag-Grid – Excellent documentation and examples. This includes materials about its Angular/React components and integration with third party software, such as OpenFin.
-
Webix – Almost as good as ag-Grid. The grid provides tons of examples and live demos, API is very well documented and easy to search and navigate. Integration with Angular/React could be covered better.
-
PrimeNG – Nice documentation and examples but lacks built-in search.
-
SlickGrid – Documentation looks a bit fragmented. Plenty of examples and demos are available.
-
HyperGrid – No manuals are available. Documentation is very basic and lacks descriptions. Most of the examples provided in the repo do not work and styling information is hard to find. The project is currently in a transitional phase; the new codebase has emerged, but infrastructure and support is falling behind. After figuring it out and creating a demo, we became very popular on Wall St as the Folks Who Figured it Out.
Conclusion
We took a look at some of the great modern web grids. Test results prove the point that web interfaces combined with modern technologies can provide a highly responsive and well performing user interface.
In this testing, the winners are:
- SlickGrid: A bit old, but lightning fast and very easy to use.
- HyperGrid: A very promising technology that may become mainstream in the future. Second place is only due to the situation with documentation/manuals, which we believe will be improved soon.
- Webix: Excellent performance in all categories, great API and documentation.
Honorable mention: ag-Grid. It wasn’t the fastest, but it was fast enough for most enterprise users’ needs, and its focus on integration with React, Angular and other mainstream frameworks, along with tech support and excellent documentation can be the key advantages to choose this grid.
Everybody had a different use case and requirement, hopefully these results can help steer you in the right direction and help manage your expectations. As you can see, some of the grids were more performant along several dimensions so that gives you some choice and ability to cater to your specific requirements. Thanks to the AMPS JavaScript client, AMPS-powered web applications can be easily built and deployed. For users who want to try these grids in action, we’ve prepared a GitHub repository with the sample projects for each grid used in the above tests. Each project also includes the AMPS configuration file and quick start instructions. Did we miss something? Do you know a great grid we should totally try? Let us know what you think!
* While Chrome and Firefox demonstrated similar performance on both Windows and Linux, Edge was different. On average, Edge performed 35% worse with ag-Grid, 50% worse with SlickGrid, had similar performance with HyperGrid, but, did notably better with Webix – 3-5 times faster than Chrome. We would appreciate any comments on why Edge works this way and how to improve its performance with other grids.