 Alert ! We released a sample AMPS plug-in for ITRS Geneos 4.0 that can be used to build real time reporting and alerting based on customizable rules and thresholds. Many of our customers are already using ITRS Geneos to consume the rich monitoring information from multiple AMPS servers and other systems to provide a real time system-wide view of health metrics. We noted that many customers seemed to be writing their integration piece in their own way so we worked with ITRS to create a generic plug-in that can be used to capture the AMPS metrics by Geneos. After working with ITRS on Geneos 4.0 support, we are pleased to announced that the AMPS-Geneos plug in is available at this public Github repo .
Brand Hunt, co-founder and President of 60East Technologies, explains: ”inside of our AMPS product, we give visibility into every component. With a product that does millions of transactions per second, 10’s of thousands of connected client sessions, and global deployment across 1000’s of servers, great monitoring is critical to the health of our customers’ business. ITRS makes it easy to consume, monitor, and propagate alerts across a large number of metrics and servers, which is why it’s our first recommendation for our largest enterprise customers. In fact, ITRS is the only monitoring system we’ve found that can take advantage of the full range of metrics exposed by our AMPS product and deliver the operational flexibility required by our most demanding enterprise customers.” - ITRS Blog
AMPS Monitoring
Whether you use ITRS Geneos, DataDog or other system - we supply a wide range of ‘canaries’ or proxy metrics that are critical to preventing and detecting faults impeding service level agreements. This blog will explore some of the best practices and means to monitoring AMPS including monitoring, logs, actions and internal events. Let’s take a step back and provide an overview of how AMPS provides this information and how you can take advantage of it.
Real Time System and Instance Monitoring
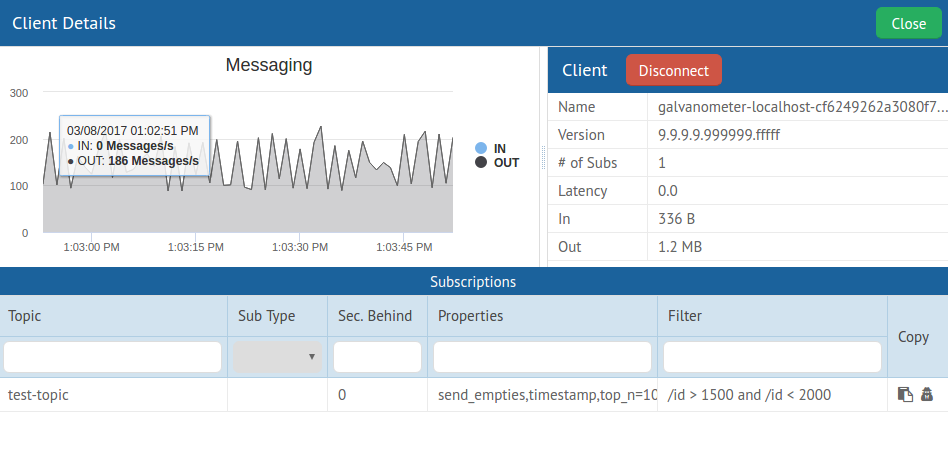
AMPS provides several ways of exposing monitoring metrics. The most prominent tool is our Galvanometer which provides a GUI for host, system and deployment statistics as well as a query facility to inspect AMPS business content. Just having a simple view of what clients are connected, and when the server restarted has been a great boon to operational insight. The roadmap for this tool is just full of practical capabilities but we are indeed looking for feedback on how it can help make your days more sane.
For more browser based or programmatic (API) based use cases - customers also leverage our entitlement-based browsable Admin Console to get a similar set of metrics as provided by the Galvanometer. This is where one can browse our monitor rich statistics such as rates, connection counts and replication performance. It also enables one to perform changes to the system such as disconnecting clients. One can also use the programmatic RESTful interface to the console to capture information from external systems.
For example, one could monitor replication statistics in this manner :
watch -n 2 "wget -qO- localhost:8087/amps/instance/replication/DR_instance/seconds_behind"Historical Data
The historical information in Galvanometer and the Admin Console comes from our optional stats.db database which allows you to run queries that compare the stats over time. Given that we store system, instance and client level information, it is a common use case to try to correlate what type of load the system was handling when a flood of a thousand connections arrived. The interval of sampling can be configured to mitigate database bloat or to facilitate fine-grained detective work.
In a typical operational use case, one can poll the Admin Console to produce ad-hoc alerts (and even publish back alerts to AMPS) and run end-of-day or week reports based on the statsdb content (before purging it etc).
For example, from the StatsDB, to view which clients have fallen behind at one time, one can run:
sqlite> SELECT s.client_name, MAX(d.queue_max_latency),
                              MAX(queued_bytes_out)
               FROM ICLIENTS_DYNAMIC d
        JOIN ICLIENTS_STATIC s ON (s.static_id=d.static_id)
        GROUP BY s.client_name;
Also, for simple external or even spreadsheet reporting, one can use the Admin Console interface to have the results of specified monitoring range sent to a csv (or text, XML, RNC etc) which can easily be turned into excel graphs/plots:
http://localhost:8085/amps/instance/processors/all/messages_received_per_sec.csv? t0=20111129T0&t1=20111129T232500Real Time Internal Event: Tracking whom is doing what
The AMPS engine publishes metrics to internal Event Topics that provide particularly useful information about client connections and the state of topics in the SOW.
The AMPS engine will publish client status events to the internal /AMPS/ClientStatus topic whenever a client issues a logon command, disconnects, fails authentication, enters or removes a subscription, queries a SOW, or issues a
sow_delete. This mechanism allows any client to monitor what other clients are doing and is especially useful for publishers to determine when clients subscribe to a topic of interest. AMPS User Guide: Event Topics
Please note that these Event Topics can be configured to be persisted so you can then access the values over a time range.
Devop Tookit: Actions and Logs
AMPS simplifies operations by providing a set of Administrative Actions which can be defined in configuration. With these powerful mechanisms, one can schedule automatic responses to either time, content or resource threshold based triggers. For example, one can invoke a user script if the free storage is under 15% or set up weekly archiving or deletion of log files or even trim the database for content that is a week old. Read more about Administrative Actions in the AMPS User Guide.
While some tail logs looking for specific messages or error levels, others leverage logging facilities such as Splunk or a Apache Flume based sink such as a Fluentd stack that ties into an HADOOP store or elastic search facility. See more about our AMPS Flume integration . Often the goal of the system is to be able to leverage the historical logs to deem what is normal and then employ machine learning to alert based on what is unusual (i.e. increased # of client connections or 3X times memory usage). Such systems are also used to ensure the appropriate maintaining of audit trails for regulatory purposes.
Business Application Monitoring: Content Limit Checking and Queue Insights
At the application level, most customers either publish information to their own monitoring topic which can be consumed by AMPS clients or stored in the SOW. Others leverage our Views on application metrics to calculate aggregations or counts as well as to implement alerts or limit checks. For example, one can easily set up complex event processing queries to capture limit checking whenever a single order has a quantity over a million or if quantity*price > million or if the aggregated count of orders thus for that listing has reached a million $. The view or aggregation can also be formed on a queue so that on can monitor or alert on the queue’s actual contents rather than just queue depth. For example, one can provide a view over a dead letter queue to see the nature of the aggregates of source and value of the trades/orders that didn’t get processed. See the Dead Letter Queue Blog . This feature is growing in popularity due to both the business and operational value of having insight into a queue’s content.
Enter ITRS Geneos
While AMPS comes with significant and well-proven monitoring capabilities, one would use Geneos to establish a sophisticated system wide alerting and reporting platform. We have implemented a number of rules that have been recommended to customers for some time. These rules not only note system performance but also to identify when the system is not performing up to expectations. Note that these aren’t necessarily Geneos specific.
Here are some examples of rules that we recommend .
-
All Processors Last Active > 20000This detects if the message processor (i.e. the AMPS engine) has not been used which could be indicative of no input or ingestion related issue or other resource constraint. -
file_system_free_percent <10This is the key to trigger an alert when the file system is down to 10% of its capacity. AMPS also has a “do” Action to provide triggered behavior based on this threshold. -
Clients queue_max_latency > 10This will help ascertain if there is an issue due to slow consumer behavior where AMPS is detecting TCP push back while trying to send data. -
Replication seconds_behind > 30During replay for recovery or back testing, this indicator highlights when there is a constraint impacting the recovery steam. -
Views queue_depth >20000The number of messages in the view that have not yet completed processing which can be indicative of a resource limitations (complex view processing can be CPU intensive).
These rules were chosen due to their prevalent use in customer environments. There are many many more rules that could be configured however their relevance depends on whether they need stats re: views, replications, the State of the World (SOW) database etc.
For More Information:
The Monitoring Reference guide lists all the aspects being monitored which can be accessed via the HTTP port. We also encourage people to use a browser to get familiar with its structure and content.
The Statistics Database Reference describes the table structure of the same statistics that you can run queries against. This also has to be enabled in the configuration file and an interval for sampling can be provided.
Alerting 60East !
We would love to hear from you about your monitoring needs. We know that you have built and ran large systems and have faced hardware and software failures and have proceeded to build up preventative practices. Please share them with us - we would like to continually improve AMPS monitoring and operational capabilities.
Thank you!